Data Analyst · Delhi NCR, India

Pratiksha
Dandriyal

Turning raw data into decisions — end-to-end analytics from data modeling and ETL pipelines to interactive Power BI dashboards. SQL Server · Power BI · Python · DAX.

Pratiksha Dandriyal
Scroll to explore

I build analytics that actually get used

I'm a BTech CSE graduate who found her calling at the intersection of data engineering and business storytelling. My approach is always the same: understand the business problem first, build clean data pipelines second, and let the visualisation speak last — because a beautiful dashboard built on dirty data is just a pretty lie. I've applied this end-to-end across real internship work — analysing 23,000+ records across multiple departments and building weekly operational reporting pipelines that directly influenced product decisions — and across three independent projects covering IT support SLA analytics, SaaS product metrics, and global workforce automation risk. I'm now looking for a full-time Data Analyst role where I can own the full pipeline, not just the last mile.

What I work with

Analytics & Visualization
Power BIDAXPower QueryKPI TrackingData StorytellingEDAGoogle Looker Studio
Data & SQL
SQL ServerMySQLData ModelingETL / ELT PipelinesData CleaningRelational DB Design
Programming
PythonPandasNumPyMatplotlibHTML / CSS / JSJupyter Notebook
Tools & Productivity
MS ExcelAdvanced Pivot TablesGit & GitHubVS CodeGoogle ColabGoogle Sheets

Where I've worked

Sep 2024 — Dec 2024
EasyGov (Surajya Services)
Internship
Data & Product Analytics Intern
  • Built a weekly reporting pipeline using SQL, Python, and Excel to extract and clean operational data across 5+ departments — delivering structured insights that directly shaped resource allocation decisions.
  • Identified recurring system failure patterns and queue time bottlenecks through SQL trend analysis; findings were directly incorporated into scheduling workflow changes by the product team.
  • Translated product team requirements into structured weekly analysis reports using Pandas, NumPy, and Matplotlib covering throughput, failure rates, and usage trends.
Jul 2024 — Aug 2024
MAX Healthcare · IT Division
Internship
Data Analyst Intern
  • Analysed 6 interconnected Excel files with 23,000+ records linked across multiple departments using common keys to surface cross-departmental patterns in operational and financial data.
  • Delivered weekly stakeholder reports on follow-up likelihood, seasonal department load, and performance by specialisation — insights referenced directly in scheduling discussions across 3 departments.
  • Quantified revenue performance across 3 locations by analysing 31 billing parameters, providing finance stakeholders a consolidated view of gross amounts, discounts, and write-offs.

Things I've built

Executive Overview
Executive Overview SLA Deep Dive Agent Performance

Click image to enlarge · 3 dashboard pages

Project 01 · Featured · Most Recent
Helpdesk Performance & SLA Analytics
Business Problem

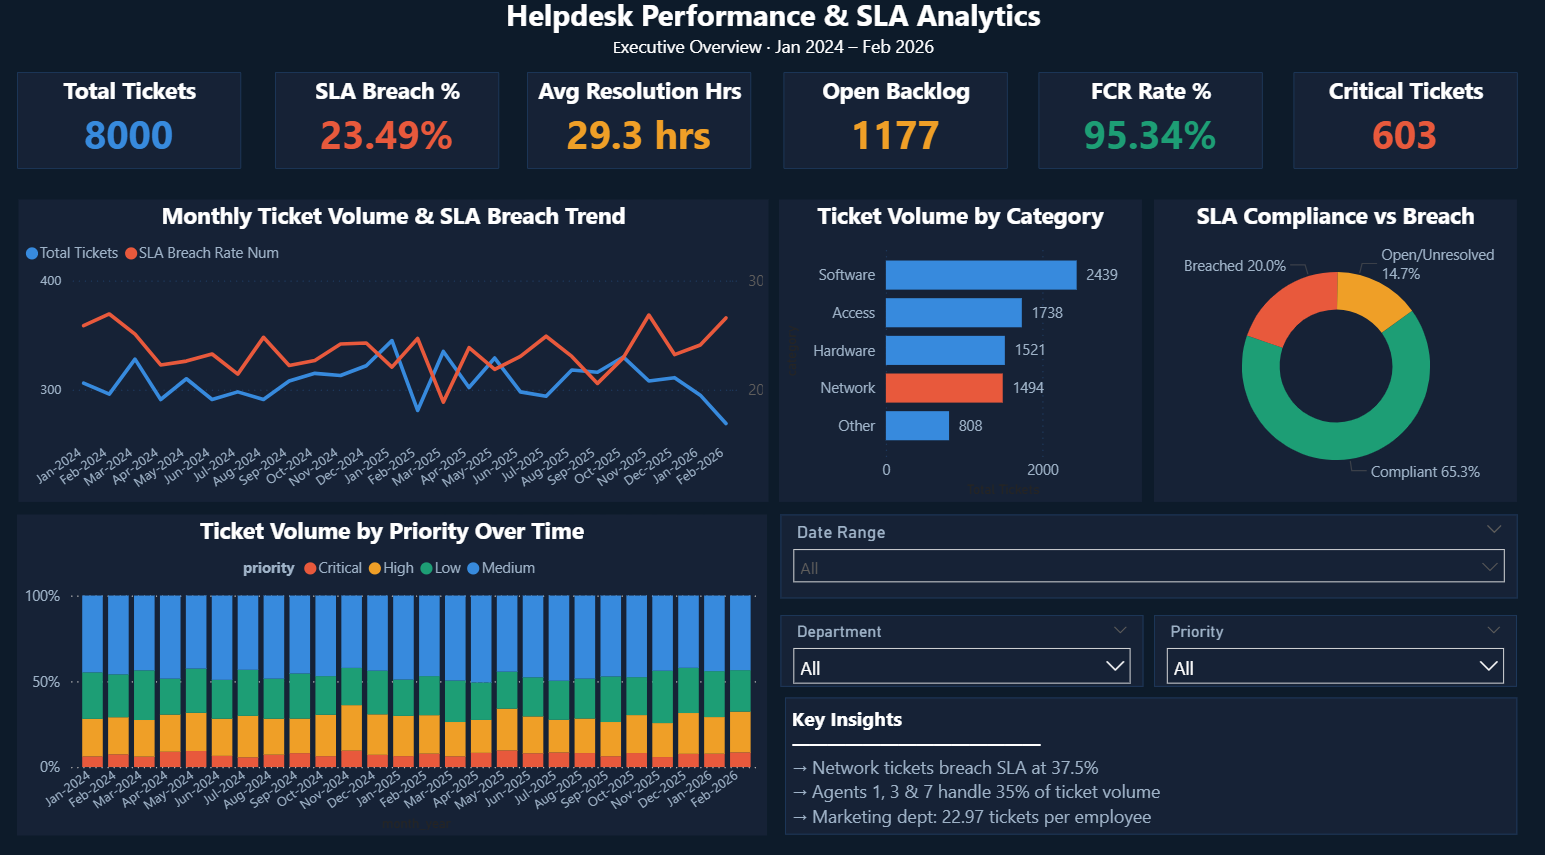
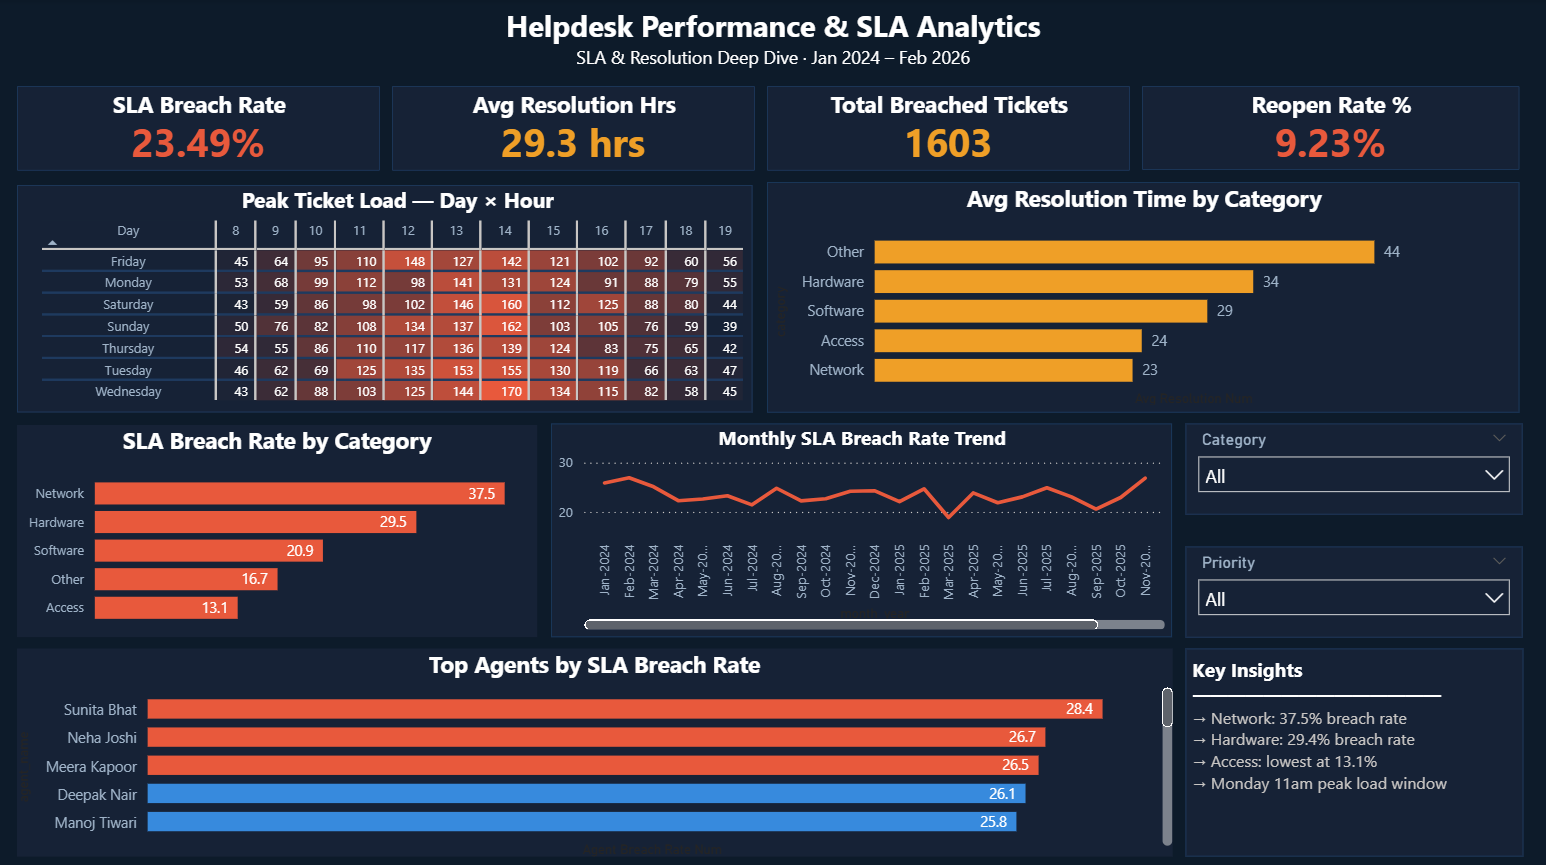
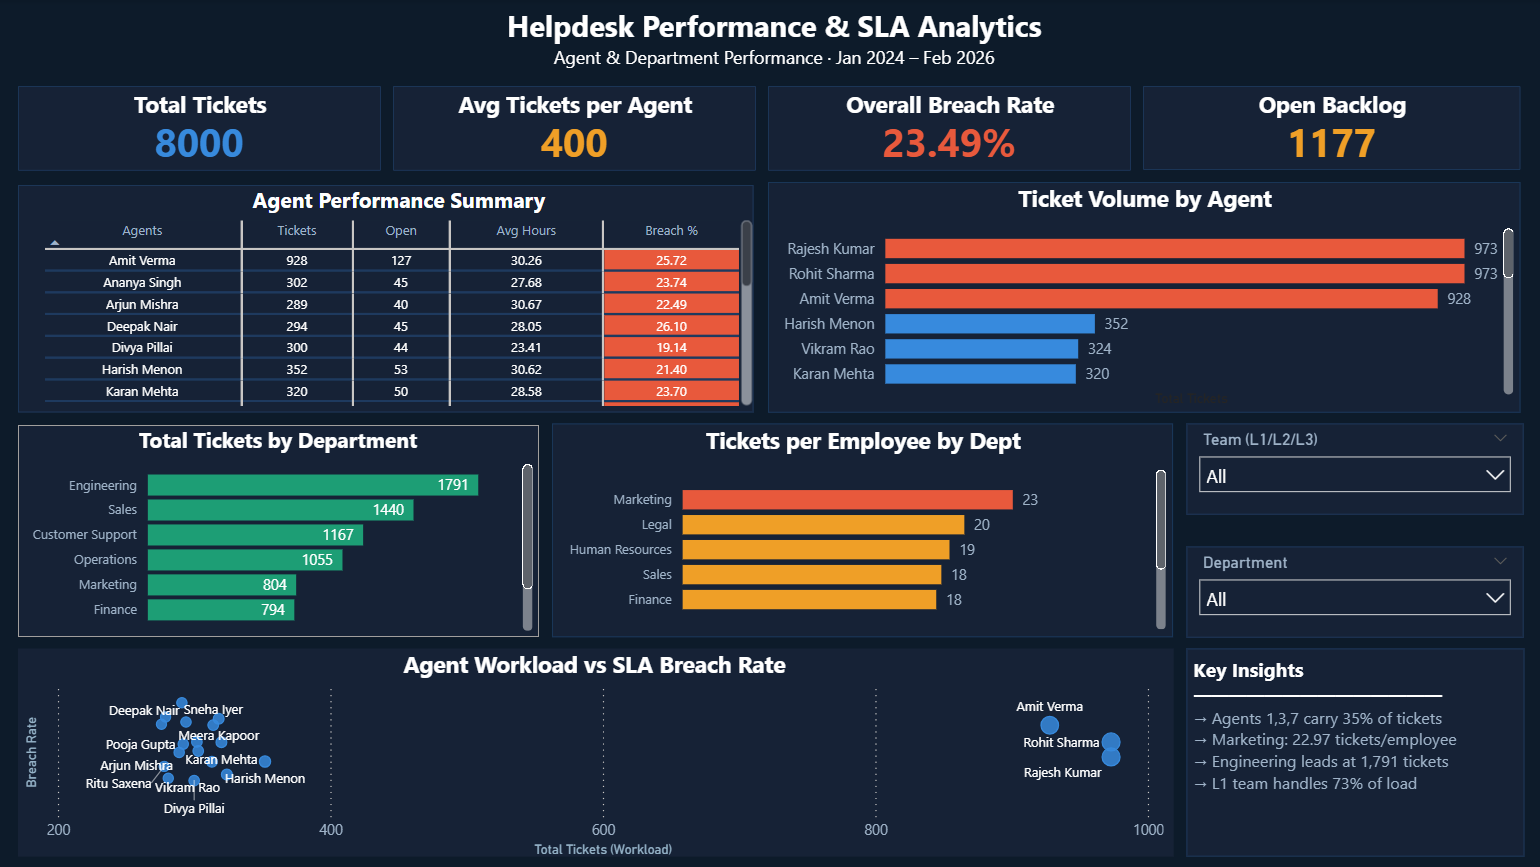
IT managers at large organisations have no visibility into why SLAs keep getting missed. They can't tell whether it's a staffing problem, a routing problem, or a category-specific issue — so every intervention is a guess. This dashboard was built to answer: where exactly is SLA compliance breaking down, and what does leadership need to do about it?

Actionable Findings
01 Network tickets breach SLA at 37.5% — the highest of any category — despite having the fastest resolution time at 23hrs. The breach happens in the 1-hour first-response window. Fix: dedicate on-call coverage during peak Monday morning hours.
02 3 agents handle 35% of all tickets (973, 973, 928 vs team avg of 400). The scatter chart shows these same agents have the highest breach rates — confirming this is a workload distribution failure, not a skill gap.
03 SLA breach rate held flat at ~23% across 26 months with no improvement trend. This rules out random variation — it's a structural problem requiring a staffing or routing intervention, not monthly process tweaks.
04 Marketing generates 22.97 tickets per employee — the highest burden ratio of any department. Despite having only 35 staff, they place more per-capita demand on IT than Engineering (120 staff). Targeted self-service training could reduce volume.
05 Peak load is Monday 11am–1pm and Wednesday 1pm. Current shift schedules don't reflect this — redistributing agent availability to weight Monday mornings would reduce the backlog that drives SLA breaches.
Technical highlights
  • 4-table normalised schema — FK, CHECK, UNIQUE constraints enforced at database level
  • DATEDIFF(MINUTE) ÷ 60.0 for decimal precision — integer DATEDIFF(HOUR) truncates and misclassifies tight 1–2hr SLA tickets as compliant
  • Dual-column JOIN on category + priority against sla_policy — per-ticket SLA threshold, not a blanket rule
  • 3 SQL views as Power BI data layer — all logic lives in SQL, not scattered across DAX
  • RANK() OVER window function for agent workload rankings without collapsing rows
  • Day × Hour heatmap matrix with conditional formatting gradient (dark navy → red)
  • Agent Workload vs Breach Rate scatter — identifies overload vs skill issues simultaneously
  • 12+ DAX measures with separate text and numeric versions for KPI card vs chart axis
SQL ServerPythonPower BIDAXData ModelingETL Pipeline
SaaS Executive Overview
Executive Overview User Behaviour Feature Adoption Churn & Retention

Click image to enlarge · 4 dashboard pages

Project 02
SaaS Product Analytics Dashboard
Business Problem

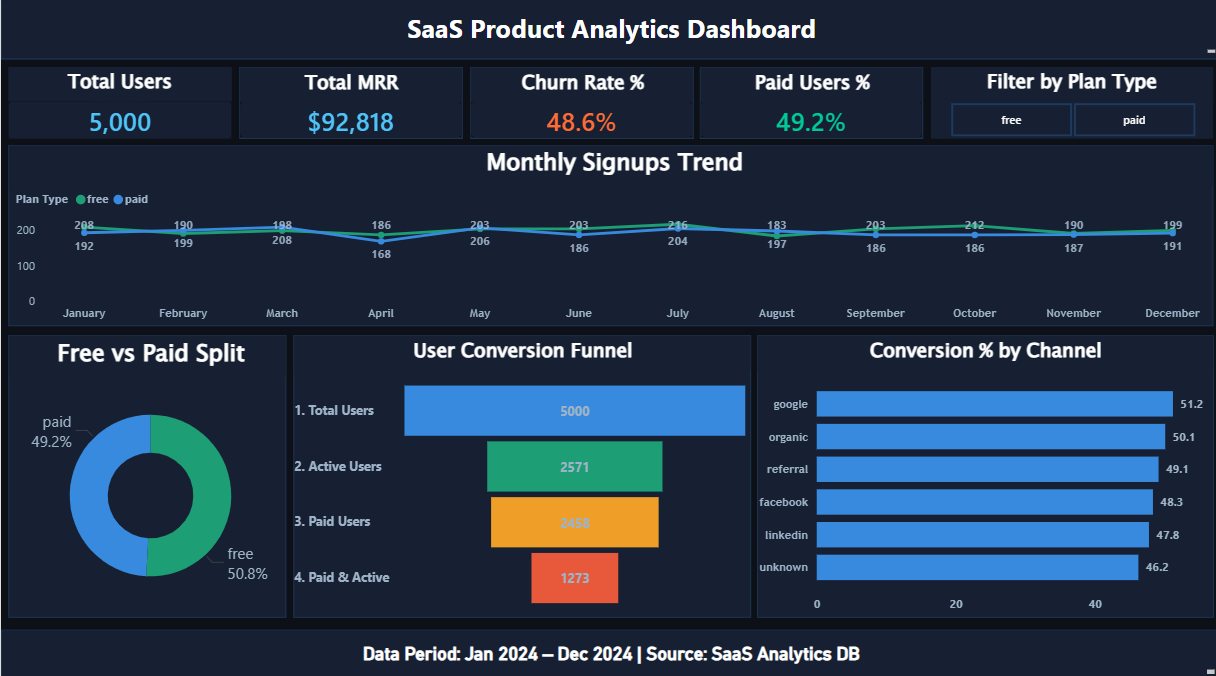
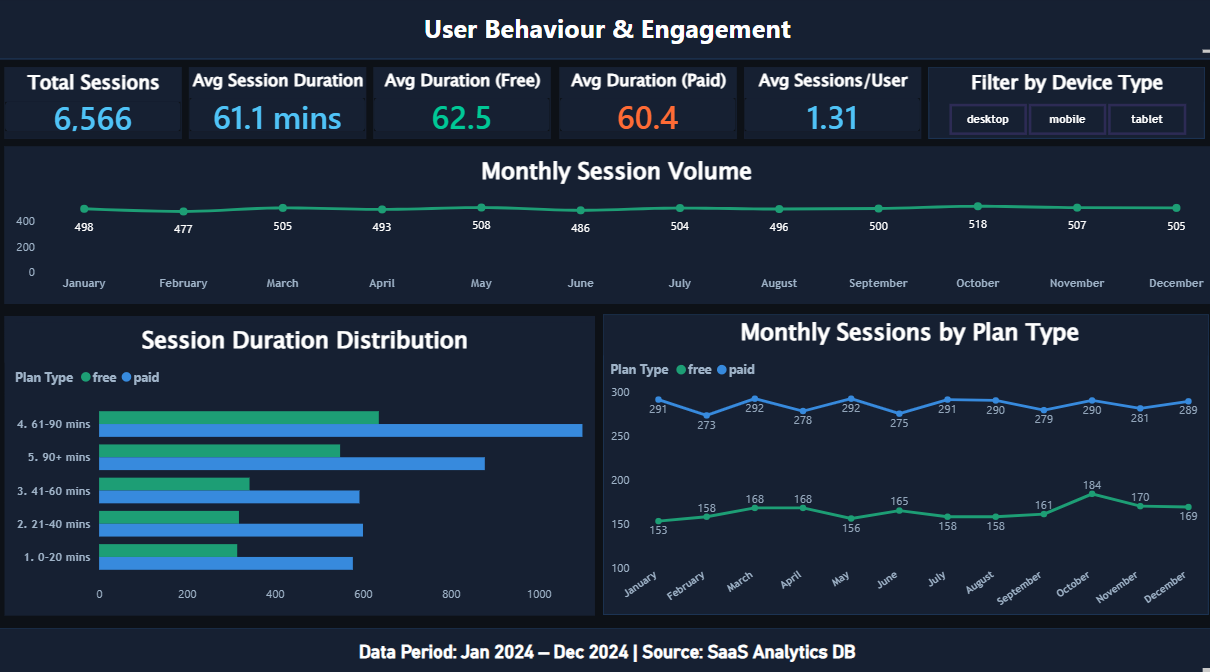
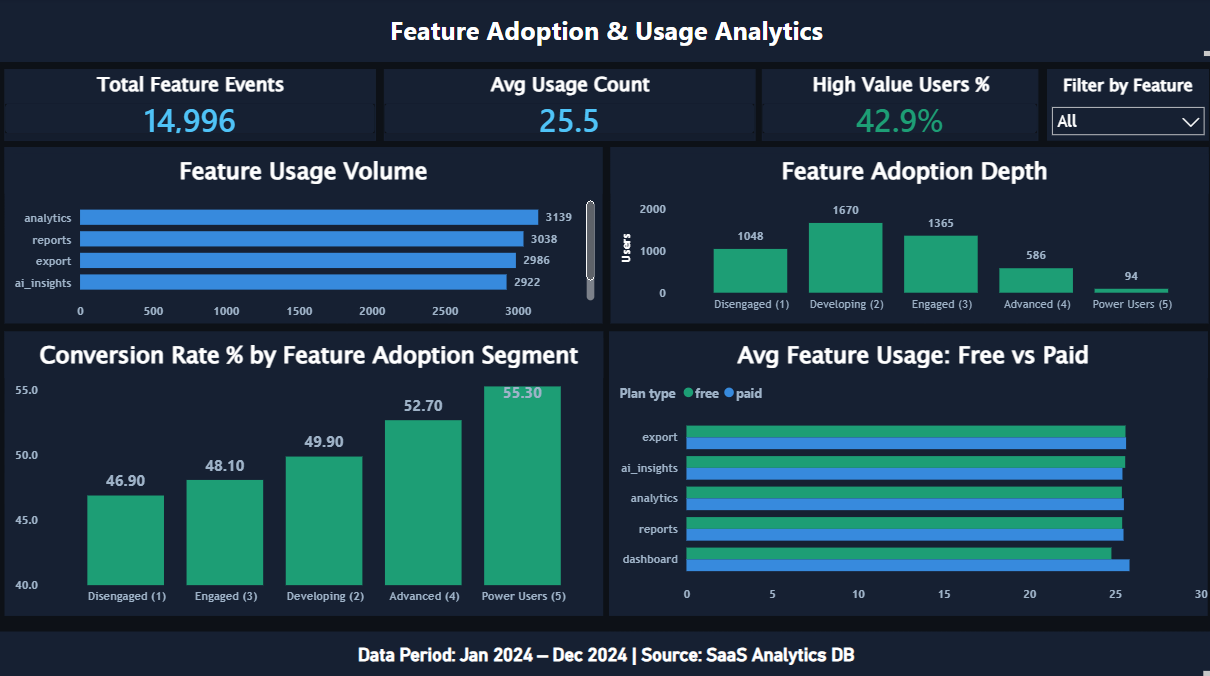
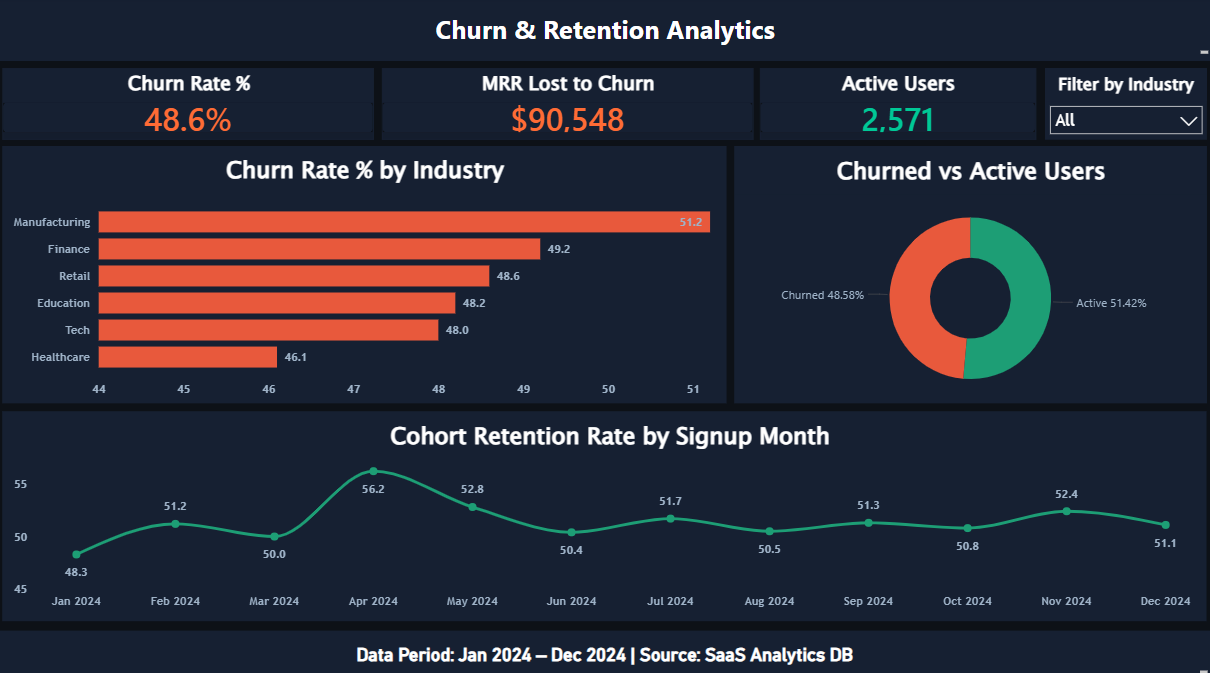
A B2B SaaS company is losing nearly as much revenue to churn as it brings in every month — but leadership doesn't know whether the problem is acquisition quality, product value, or onboarding failure. This dashboard was built to answer: why are users churning, which users are worth saving, and where should the product team invest first?

Actionable Findings
01 Only 1 in 4 users is both paying and retained (1,273 of 5,000). The funnel shows 5,000 signups → 2,571 active → 2,458 paid → 1,273 paid and active. The business is spending acquisition budget while churn silently offsets every new signup.
02 $90,548 in MRR is lost to churn vs $92,818 retained — the business is running a leaky bucket where every $1 of acquisition is offset by $0.98 of churn loss. Fixing retention is worth more than scaling acquisition spend.
03 Users adopting 5 features convert at 55.3% vs 46.9% for single-feature users — an 8.4pp gap. Improving onboarding to drive early multi-feature adoption is the highest-ROI product decision available right now.
04 Free users engage longer than paid users (62.5 vs 60.4 mins avg session). This is a product value signal, not an engagement problem — paid users aren't extracting proportional value from their plan, which drives churn.
05 Google converts best (51.2%) but also churns fastest. Referral users pay $73 avg MRR vs Google's $69 and retain better — shifting acquisition investment toward a referral programme yields higher lifetime value users.
Technical highlights
  • Star schema: users (dim) → sessions, feature_usage, subscriptions (3 fact tables)
  • Sequential TRY_CONVERT with 3 style codes (23, 101, 105) — ISO, US, and European date formats in the same column
  • Session deduplication: 20,000 → 6,566 rows using MIN(session_id) per user + date + device
  • 25+ DAX measures covering MRR, churn, feature adoption depth, and cohort retention
  • Numeric + display measure pairs — Power BI chart axes reject text; KPI cards need formatted strings
  • Cohort retention analysis by signup month — April 2024 cohort retains best at 56.2%
SQL ServerPythonPower BIDAXStar SchemaCohort Analysis
AI Job Displacement Overview
Overview Risk Analysis Salary Analysis Skills & Reskilling

Click image to enlarge · 4 dashboard pages

Project 03
AI Job Displacement & Reskilling Dashboard
Business Problem

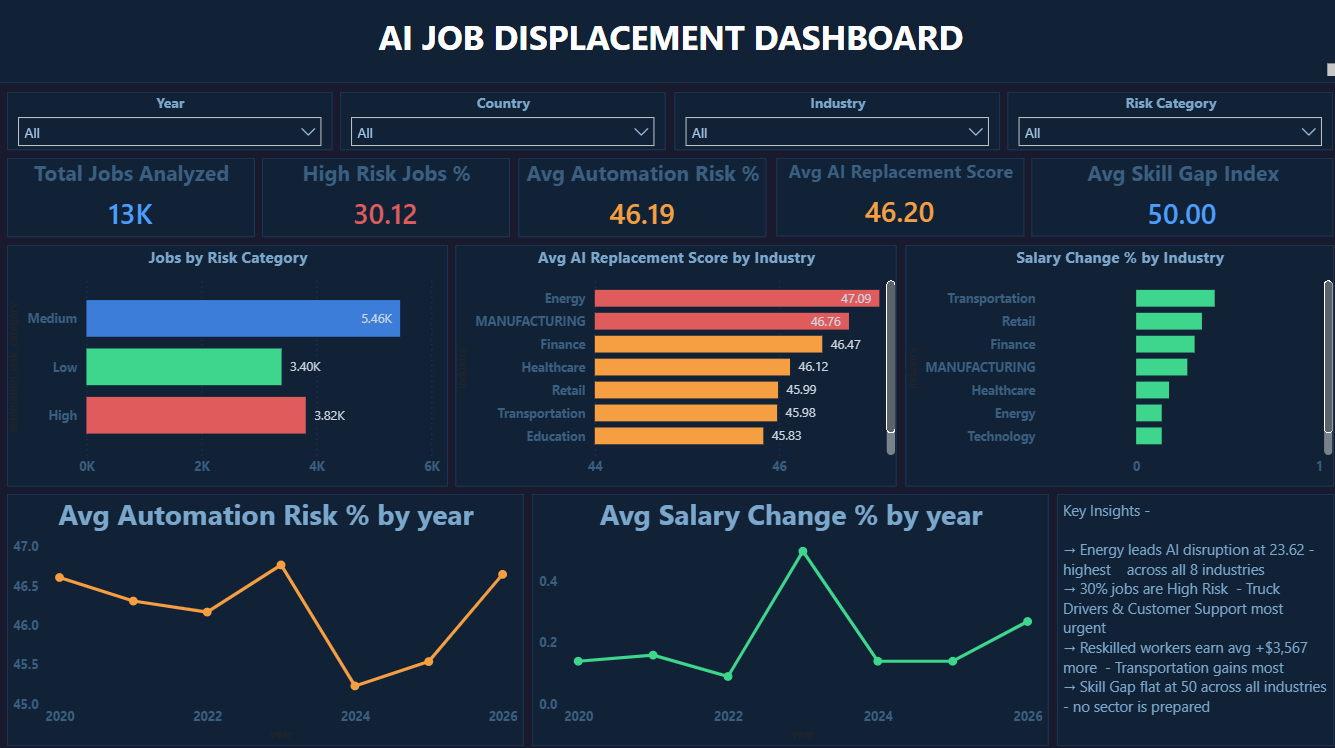
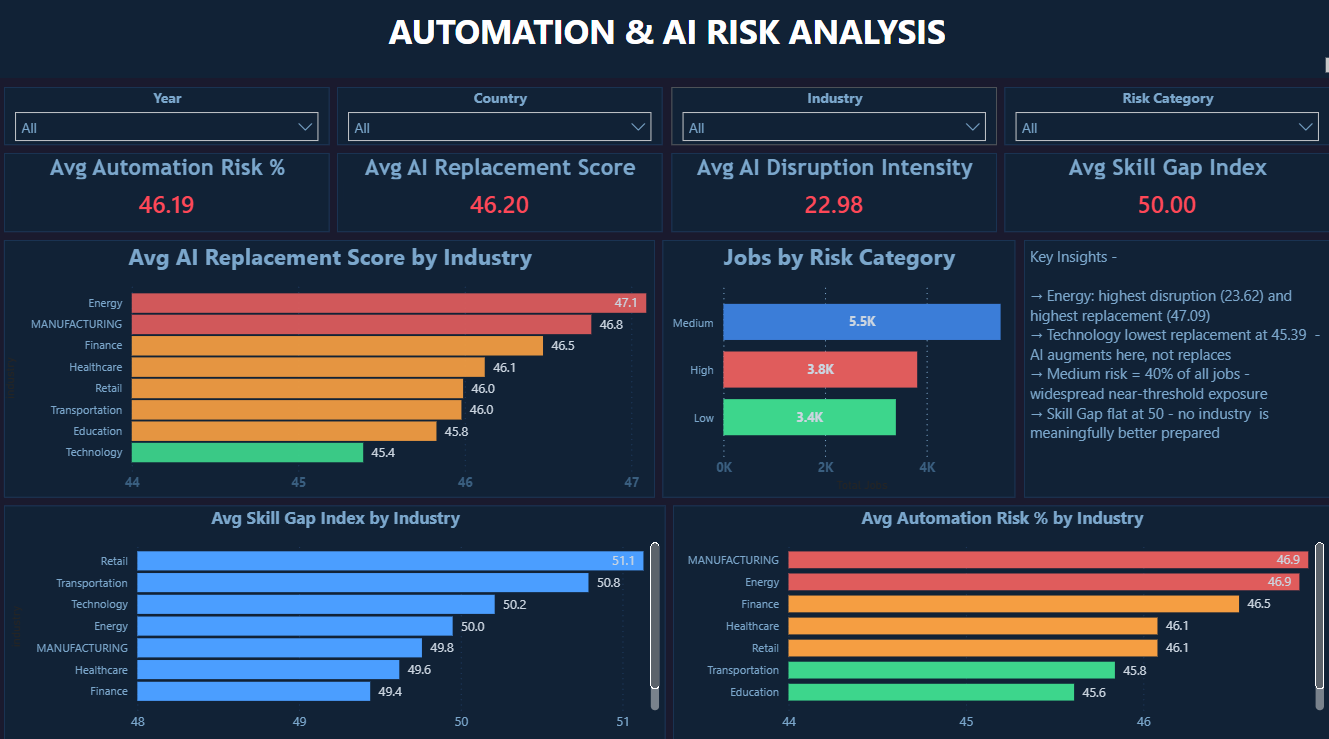
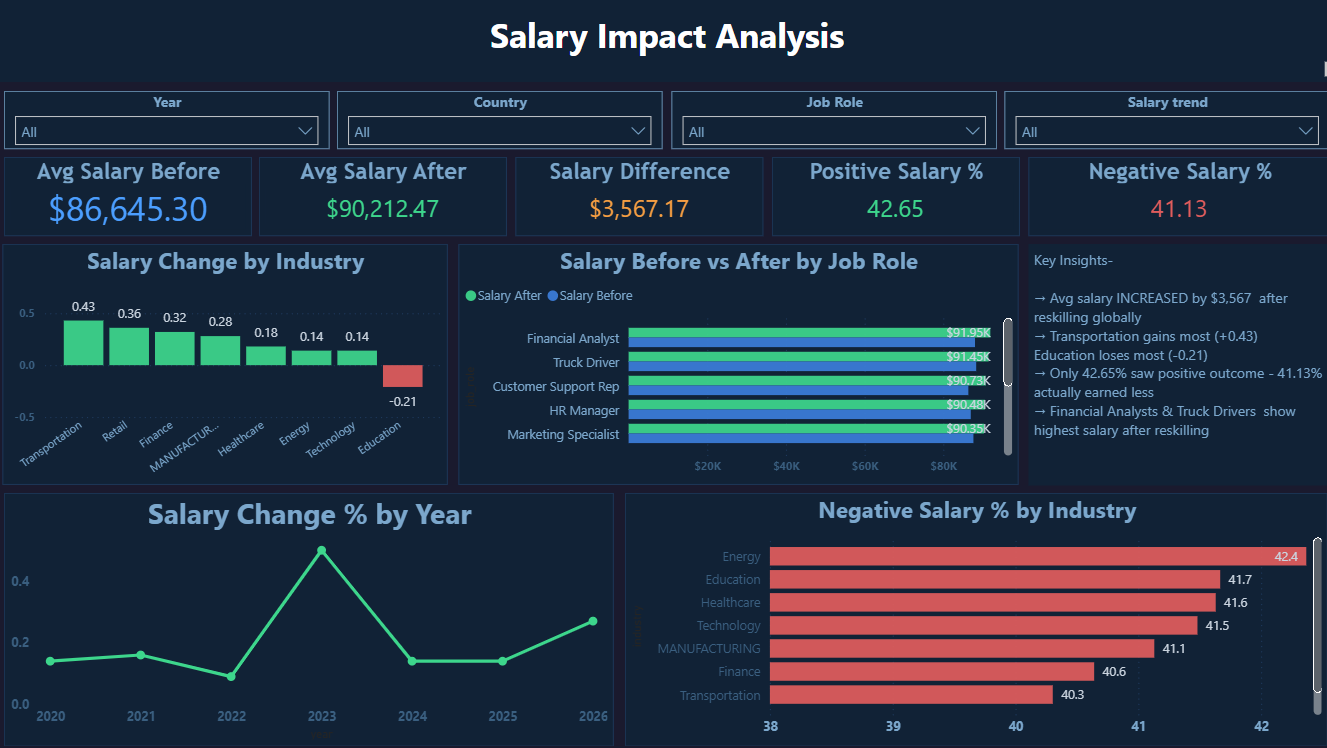
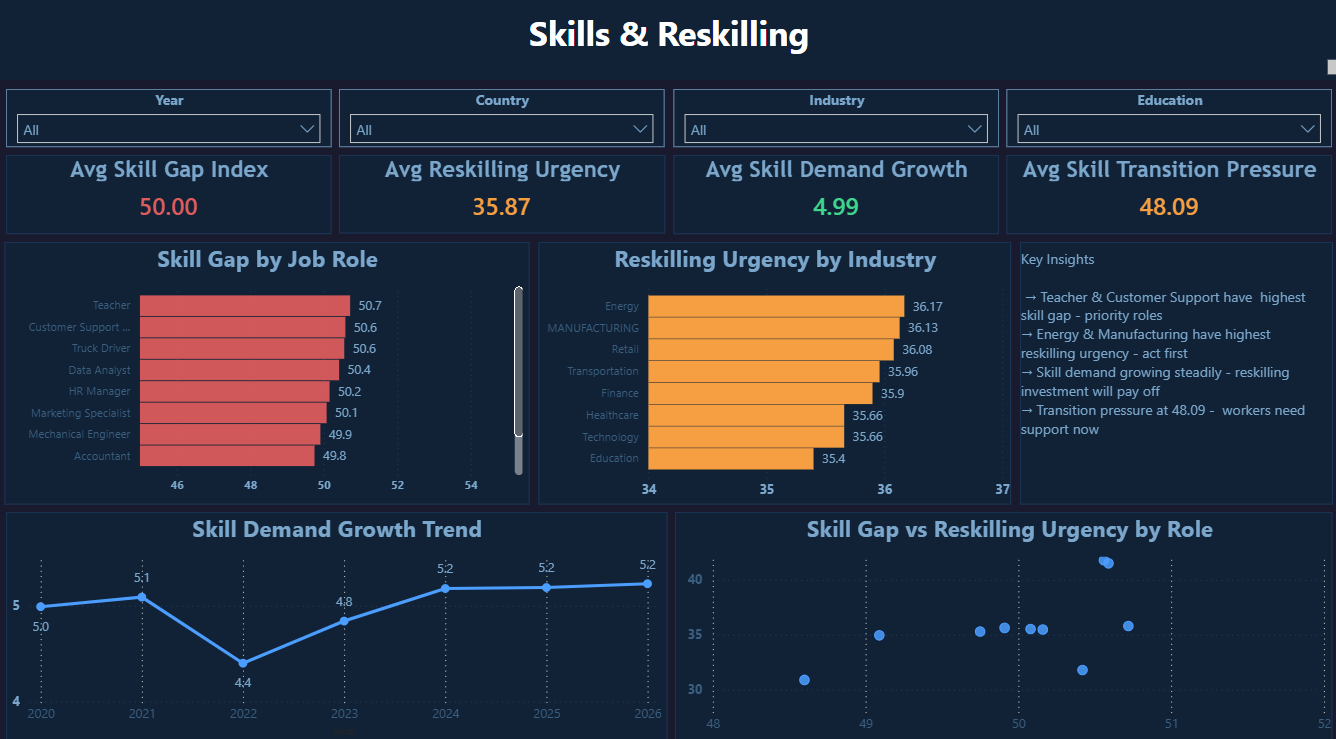
Organisations and policymakers know AI disruption is happening — but they can't quantify where, how fast, or who is most at risk. Without structured data, reskilling budgets get allocated based on assumption rather than evidence. This dashboard was built to answer: which roles and industries need reskilling intervention first, and does reskilling actually translate to better salary outcomes?

Actionable Findings
01 Energy leads AI disruption intensity at 23.62 — the highest across all 8 industries — while also having a high automation risk of 46.9%. This double exposure makes Energy the highest-priority sector for workforce intervention.
02 Technology has the lowest AI replacement score at 45.39 — AI augments rather than replaces in this sector. Reskilling investment here yields workers who collaborate with AI tools, not workers who compete with them.
03 Reskilling increases average salary by $3,567 globally — but 41.13% of workers actually earned less after displacement. The average masks a deeply unequal outcome. Transportation gains most (+0.43%), Education loses most (−0.21%).
04 Skill Gap Index is flat at 50 across all 8 industries — no sector is meaningfully better prepared than any other. This means the reskilling problem is systemic, not sector-specific, and requires broad policy action rather than targeted industry programmes.
05 30% of jobs fall in the High risk category; the largest group (42%) is Medium risk — widespread near-threshold exposure. Teacher and Customer Support roles have the highest skill gap index and reskilling urgency simultaneously — priority candidates for programme investment.
Technical highlights
  • 6 categories of data quality issues resolved: NULLs, duplicates, inconsistent casing, salary outliers, invalid category variants, year string corruption
  • ROW_NUMBER() window function for deduplication — PARTITION BY job_id keeps first occurrence
  • CASE statement normalising 6 corrupt risk category variants to High / Medium / Low
  • salary_trend derived column from salary_change_percent thresholds — Positive (>2%), Negative (<−2%), Stable
  • 12+ DAX measures across automation risk, salary delta, reskilling urgency, and skill gap index
  • Skill Gap vs Reskilling Urgency scatter chart — two-dimensional view for prioritising intervention
SQL ServerPythonPower BIDAXPower QueryData Quality Engineering

Formally trained, self-driven

Computer Science gave me the engineering foundation. Everything analytics came from building real projects, solving real problems, and obsessing over the gap between data and decision.

B.Tech — Computer Science & Engineering
Dr. APJ Abdul Kalam Technical University, India
CGPA 8.23 / 10.0 Graduated Sep 2025
Certifications
Microsoft Power BI Desktop for Business Intelligence
Udemy · 2026
Python for Data Analysis & Business Intelligence
Udemy · 2026
SQL for Data Analysis: Advanced SQL Querying Techniques
Udemy · 2025
Introduction to AI
IBM SkillsBuild · 2024

Open to opportunities

Actively looking for Data Analyst roles in India — open to IT services, product, and analytics teams.

Download Resume ↓