Actionable findings
What the data revealed
01
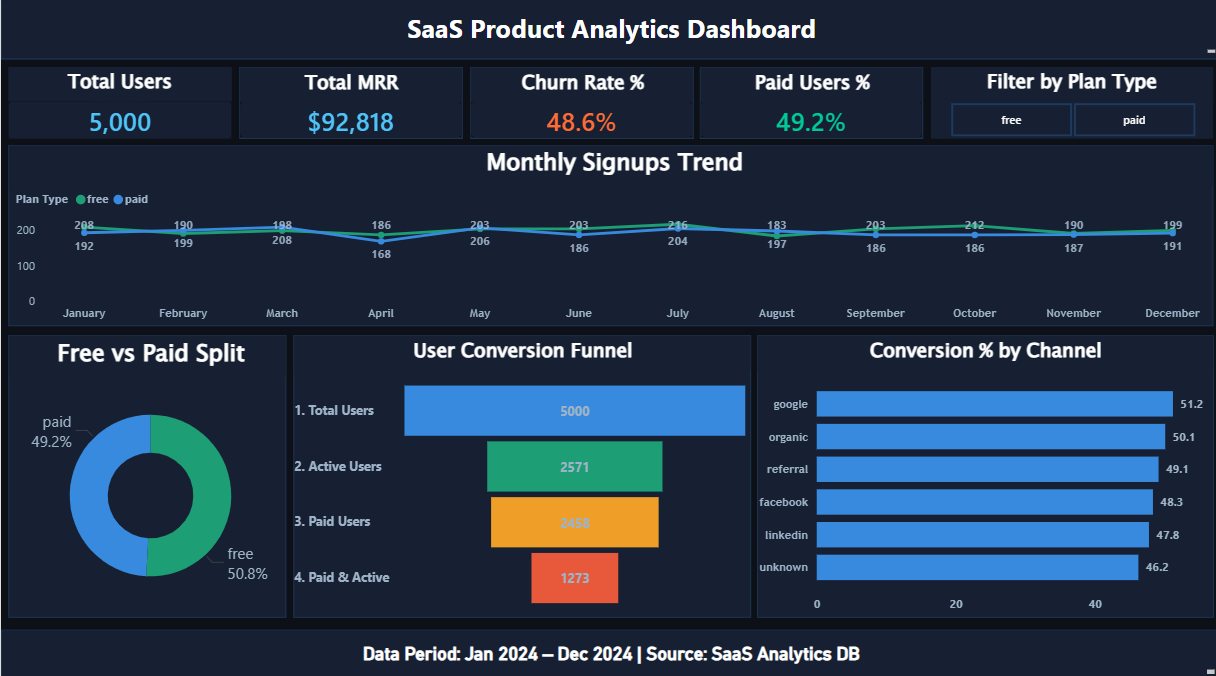
Only 1 in 4 users is both paying and retained (1,273 of 5,000). The funnel shows 5,000 signups → 2,571 active → 2,458 paid → 1,273 paid and active. The business is spending acquisition budget while churn silently offsets every new signup.
02
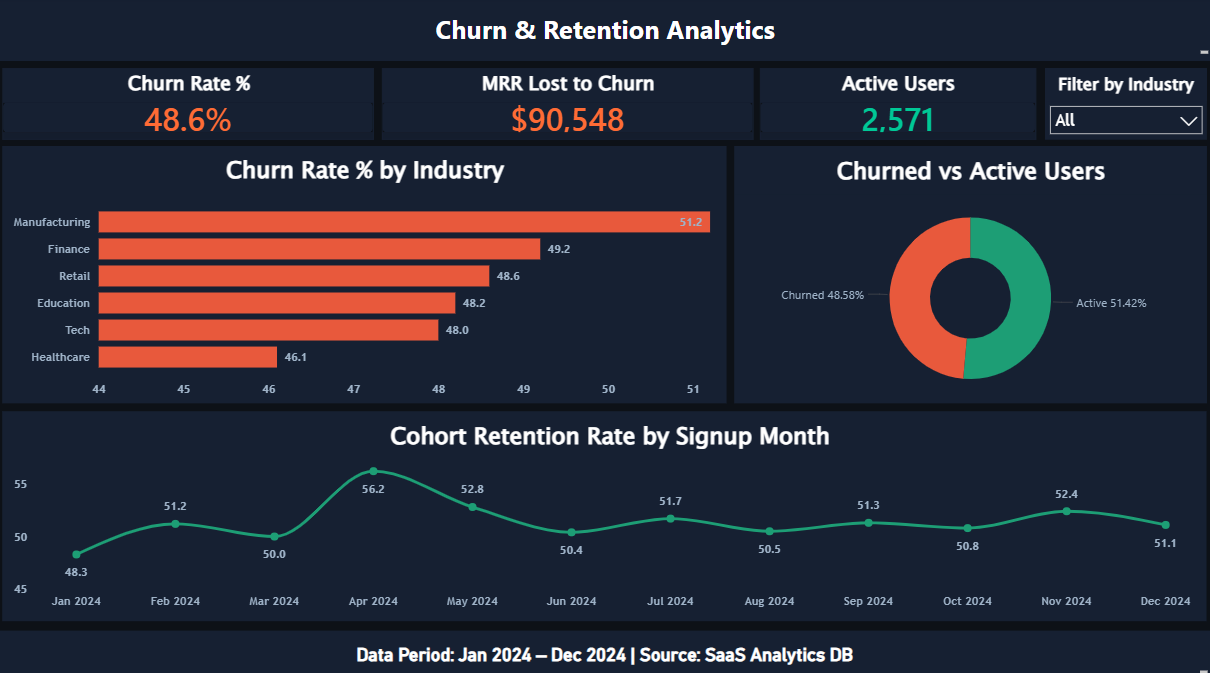
$90,548 in MRR is lost to churn vs $92,818 retained — the business is running a leaky bucket where every $1 of acquisition is offset by $0.98 of churn loss. Fixing retention is worth more than scaling acquisition spend right now.
03
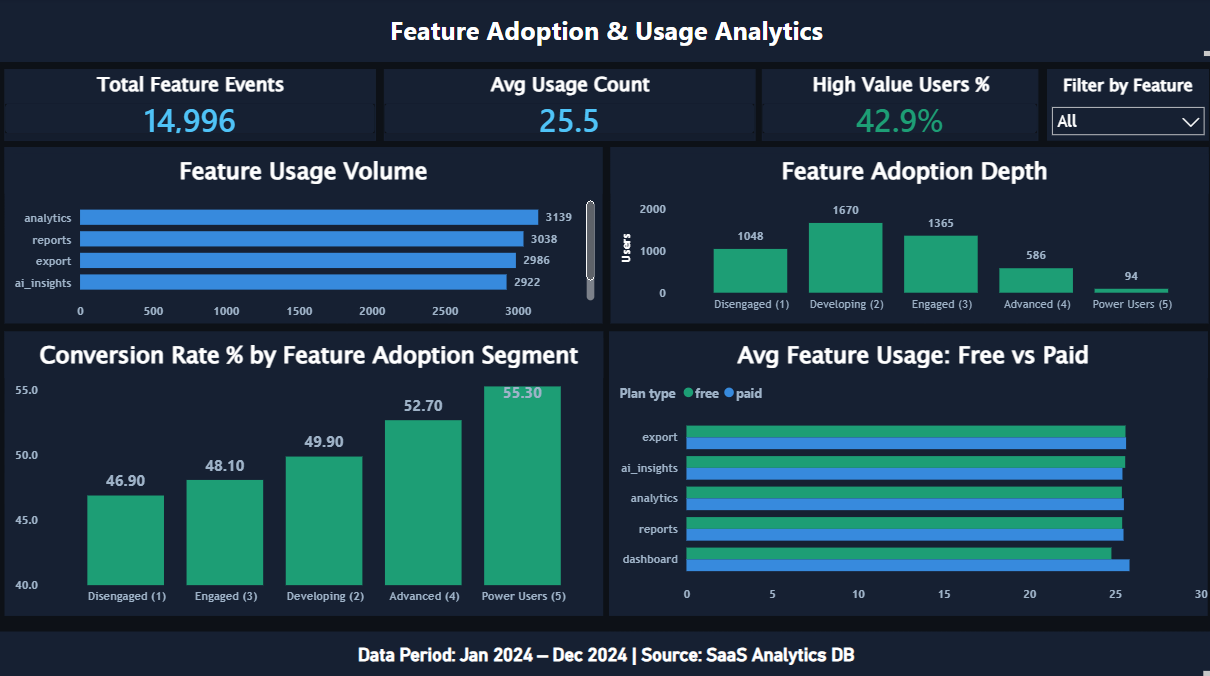
Users adopting 5 features convert at 55.3% vs 46.9% for single-feature users — an 8.4 percentage point gap. Improving onboarding to drive early multi-feature adoption is the highest-ROI product decision available.
04
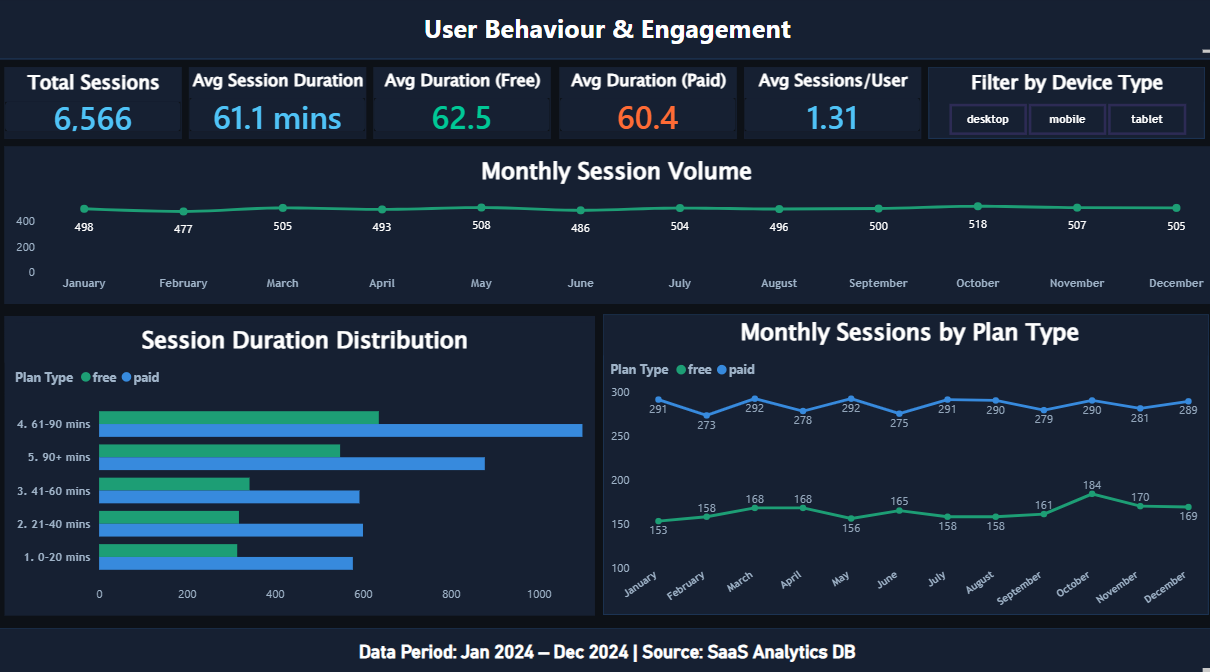
Free users engage almost as long as paid users (62.1 vs 60.3 mins avg session) — a narrow 1.8-minute gap, not the wide engagement drop-off you'd expect if paying unlocked meaningfully more to do. It's a soft signal worth monitoring rather than a proven churn driver, and a cheaper cohort analysis to run before assuming a bigger feature-gating fix is needed.
05
Google converts best (51.2%) but also churns fastest. Referral users pay $73 avg MRR vs Google's $69 and retain better — shifting acquisition investment toward a referral programme yields higher lifetime value users.
Dashboard preview
4-page Power BI dashboard
Click main image to enlarge · 4 pages
Technical highlights
How it was built
Star schema: users (dim) → sessions, feature_usage, subscriptions (3 fact tables) — enables a single slicer to cascade across all visuals
Sequential TRY_CONVERT with 3 style codes (23, 101, 105) — ISO, US, and European date formats mixed in the same column across all tables
Session deduplication: 20,000 → 6,566 rows using MIN(session_id) per user + date + device combination
25+ DAX measures covering MRR, churn rate, feature adoption depth, cohort retention, and conversion funnel
Numeric + display measure pairs — Power BI chart axes reject text measures; KPI cards need formatted strings
Cohort retention analysis by signup month — April 2024 cohort retains best at 56.2%, indicating something that worked differently in that month's acquisition or onboarding